How do I show report statistics to my employees?
You can grant your employees access to the report statistics. Here they can get an overview of the reports over a certain time period, customers, report types, etc.
This enables your employees to gain an overview of their filled-out reports.
Read this article to find out, how employees can get access to the report statistics:
- How to activate the setting
- This is what your employees can see when you activate the setting
- This is how you set up report templates so that employees are able to see the statistics
How to activate the setting
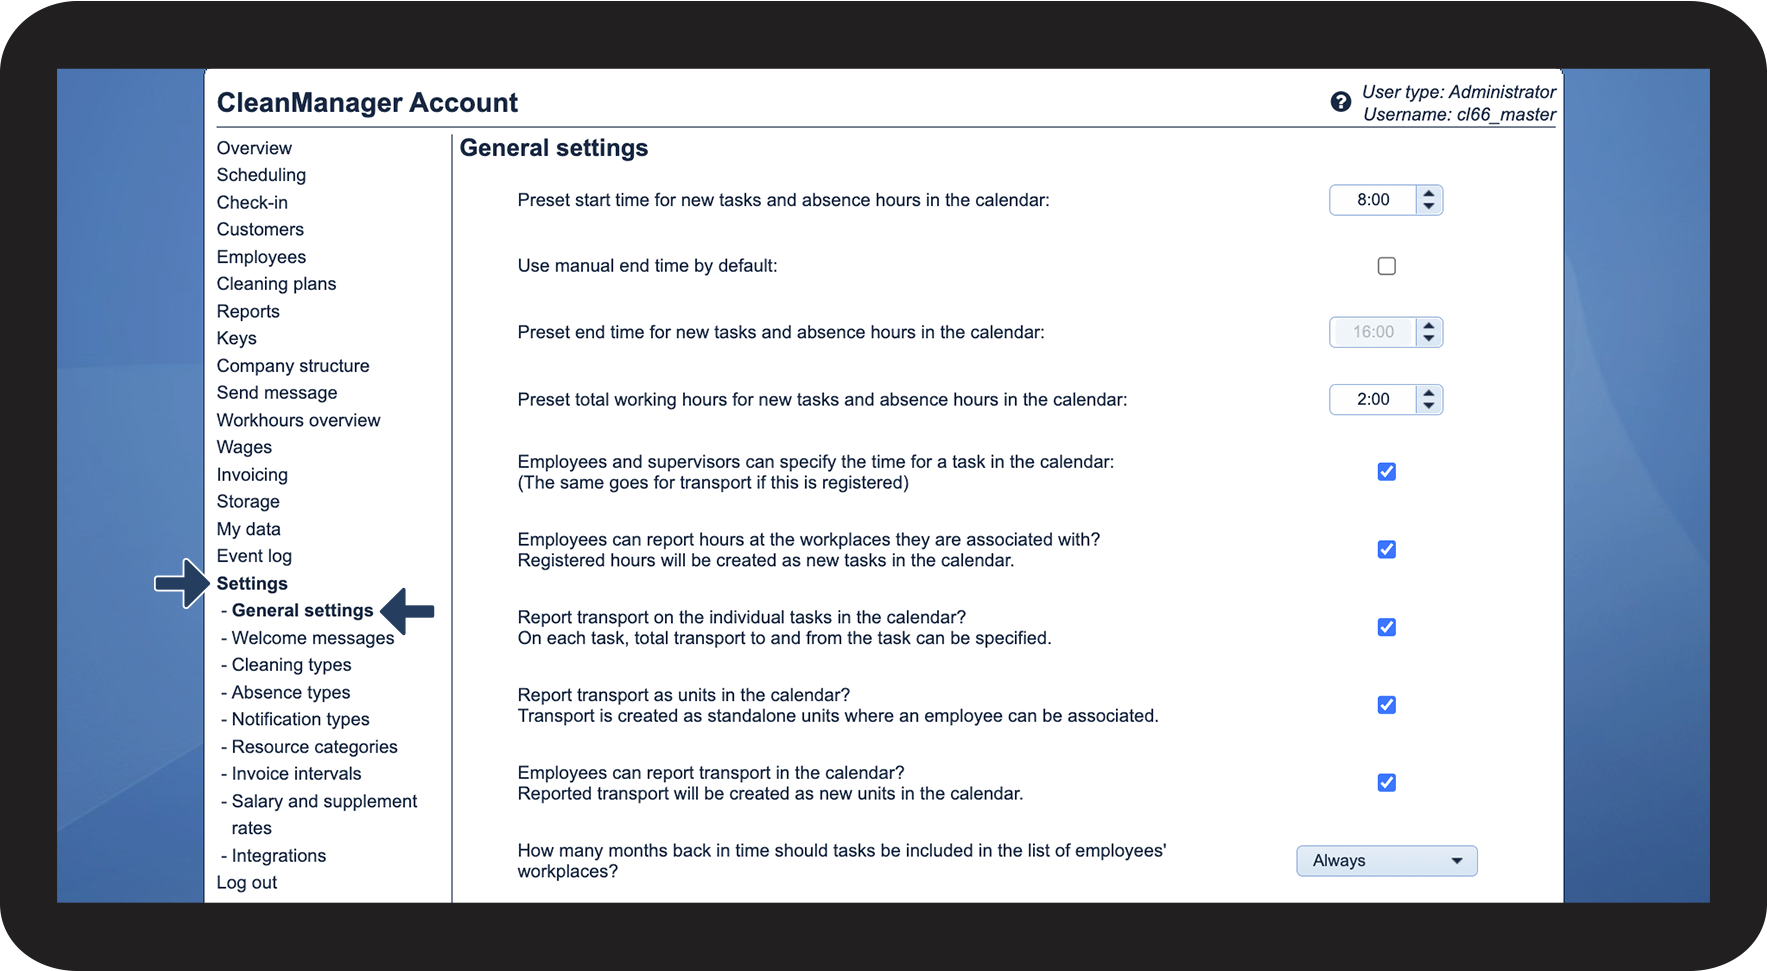
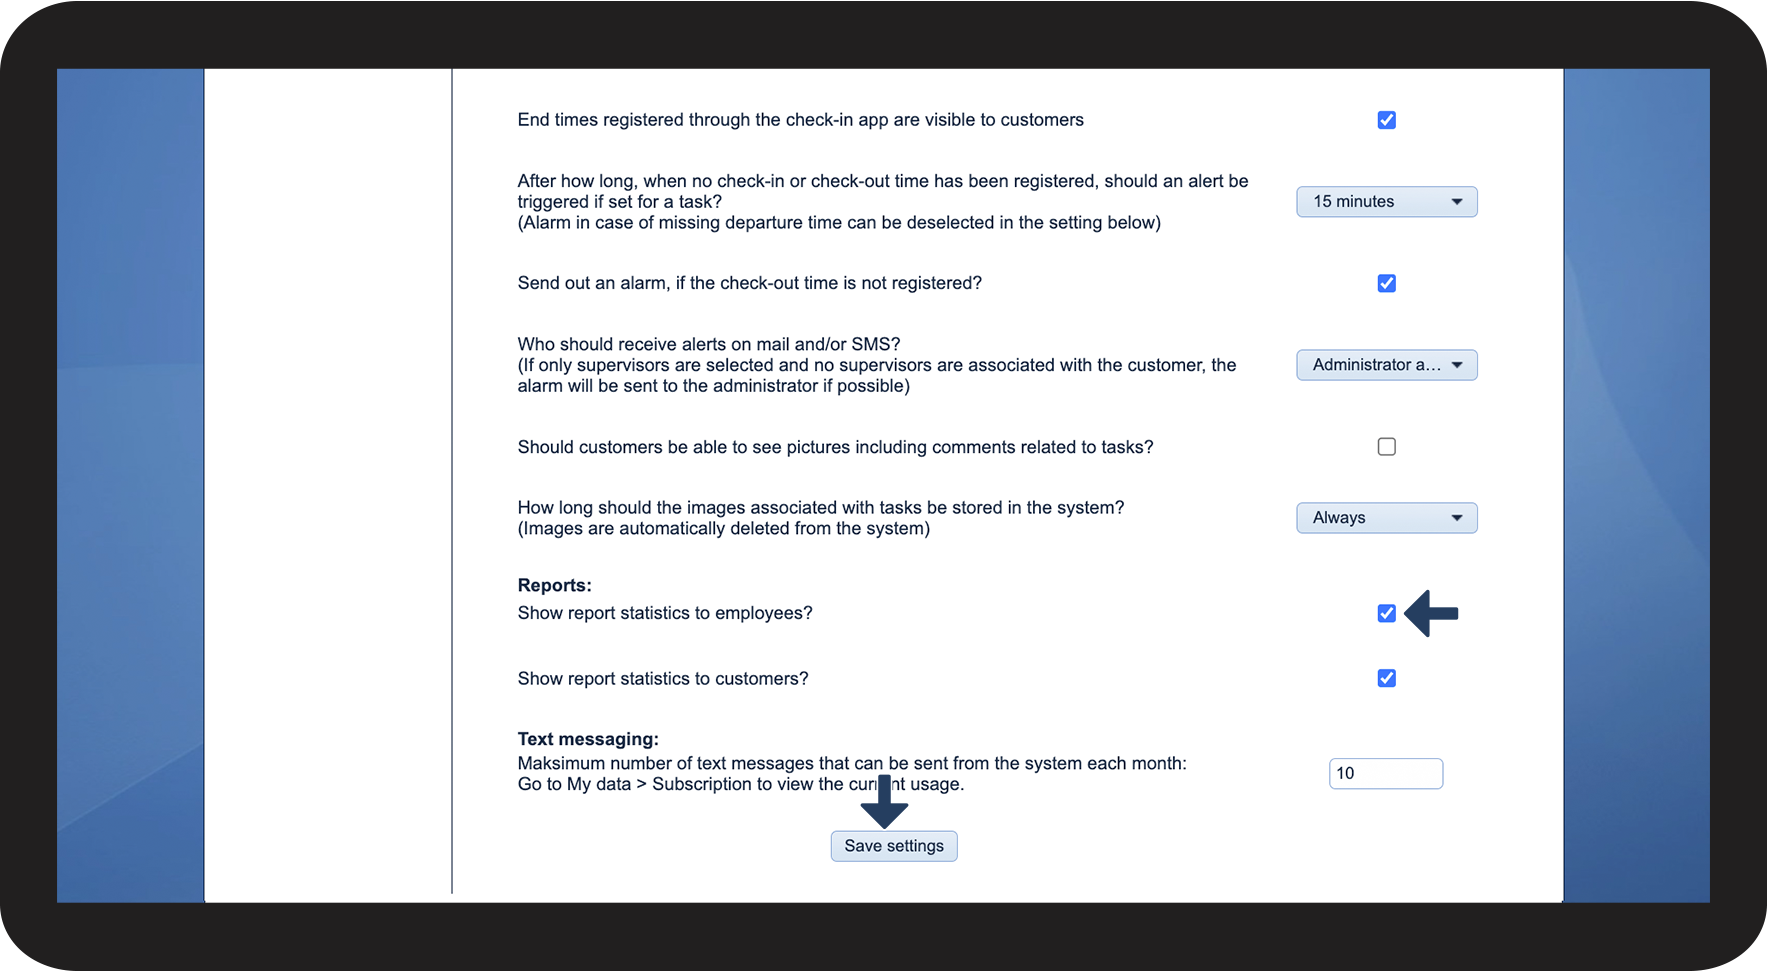
Employees can receive access to the report statistics when the setting Show report statistics to employees has been activated under General settings > Reports.
Note:
This setting only works in the web version of CleanManager and not in the app.
INFO:
If you would like for customers to be able to see the report statistics as well, you can give them access by adding a tick in the box next to Show report statistics to customers.
This is what your employees can see when you activate the setting
Note:
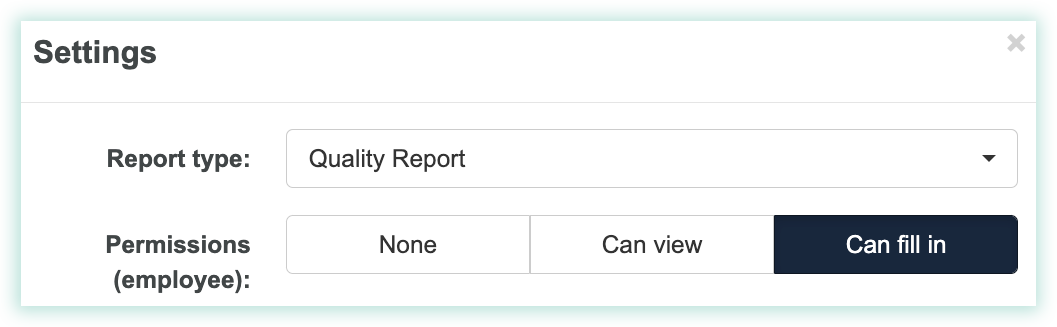
For the reports to be included in the statistics, it is necessary to set the reports templates to "Can view" or "Can fill in" when setting up a report template.
For more information continue reading this article.
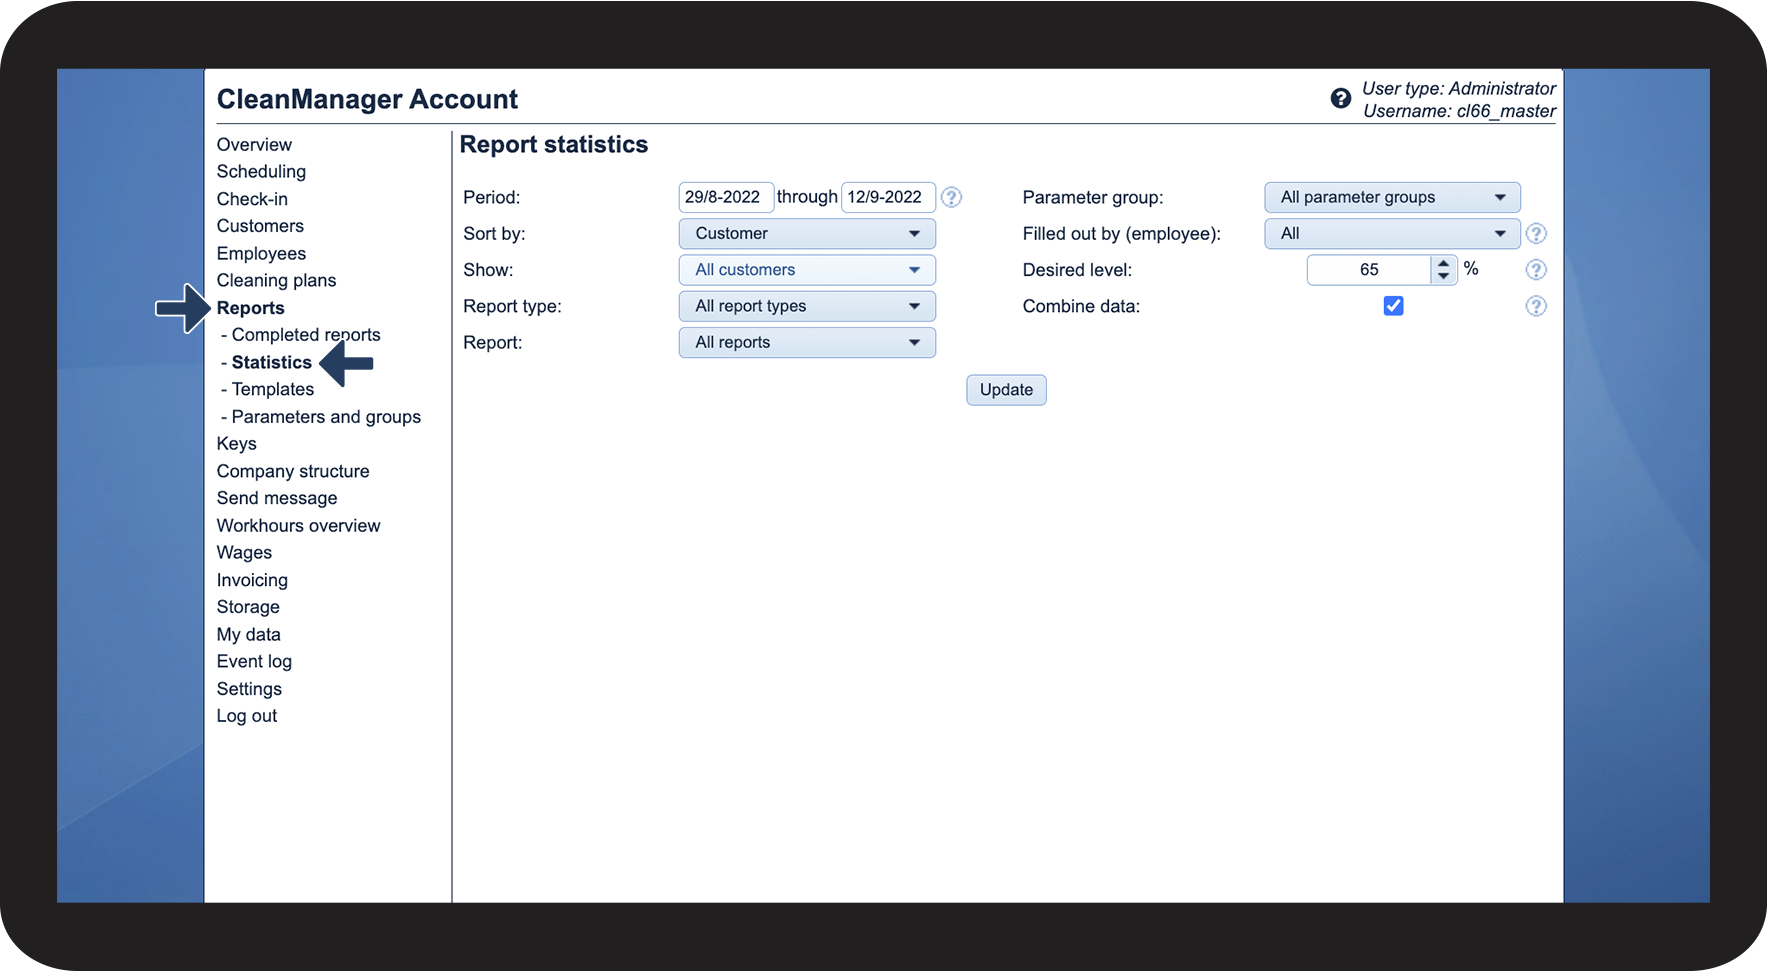
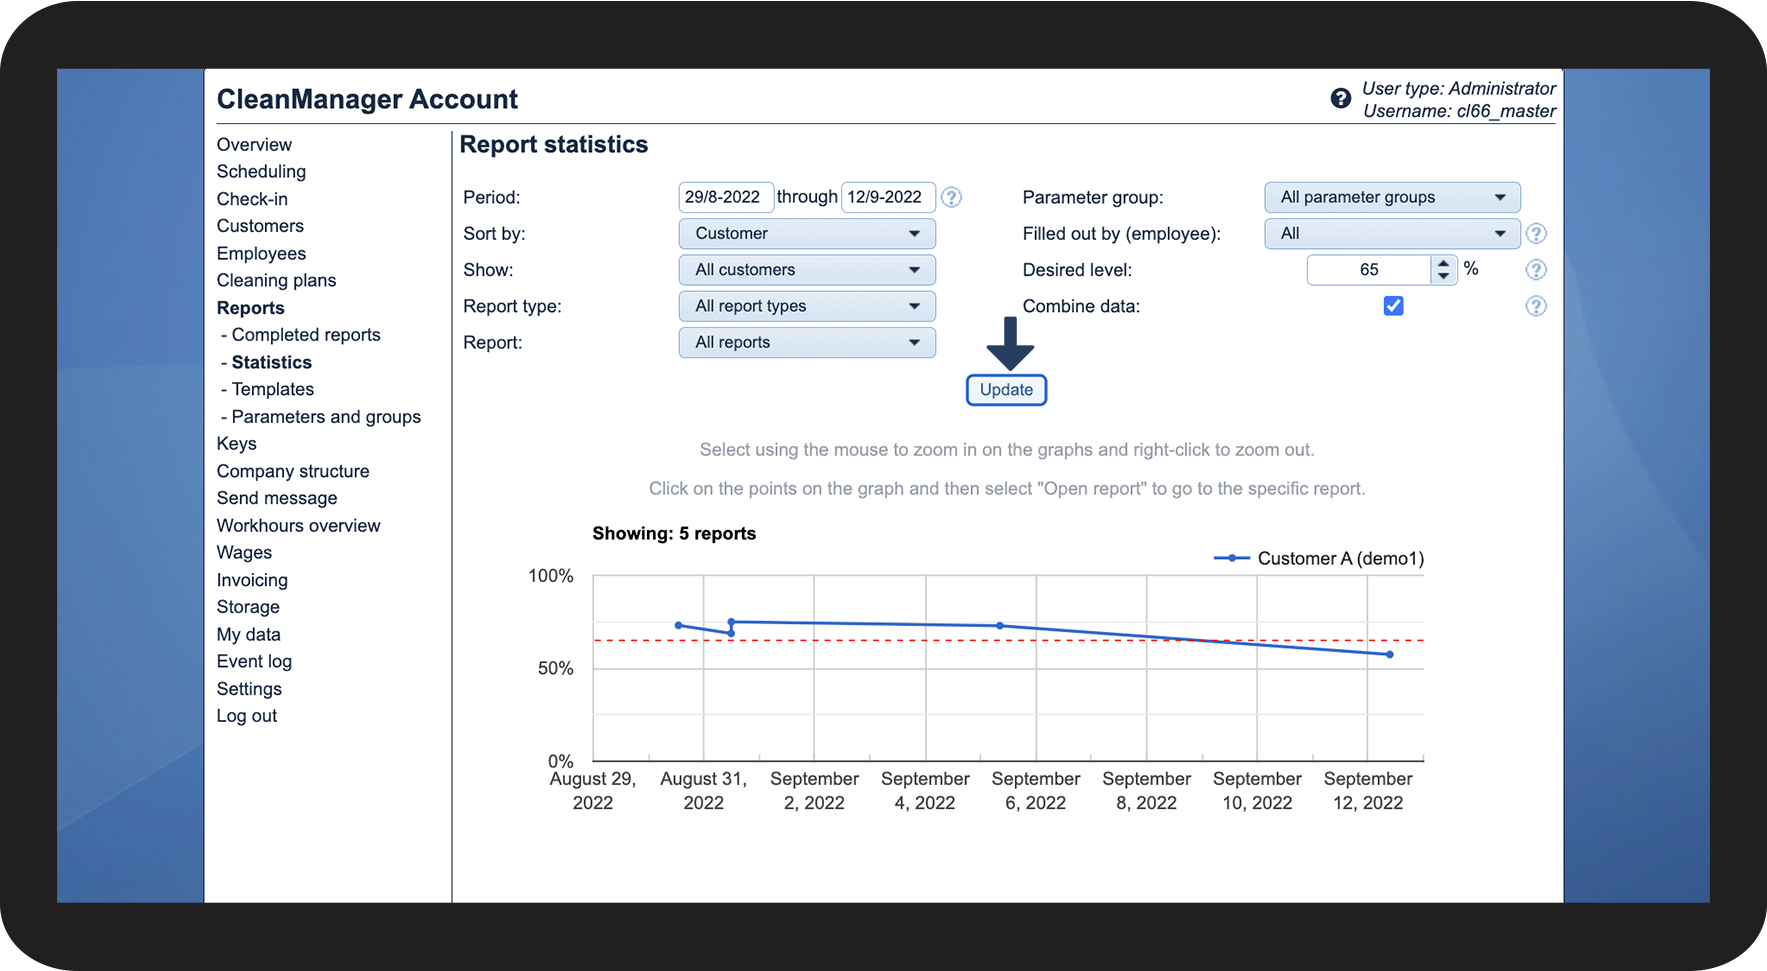
After the setting "Show report statistics to employees" has been activated, the sub-menu point Statistics will appear under the category Reports.
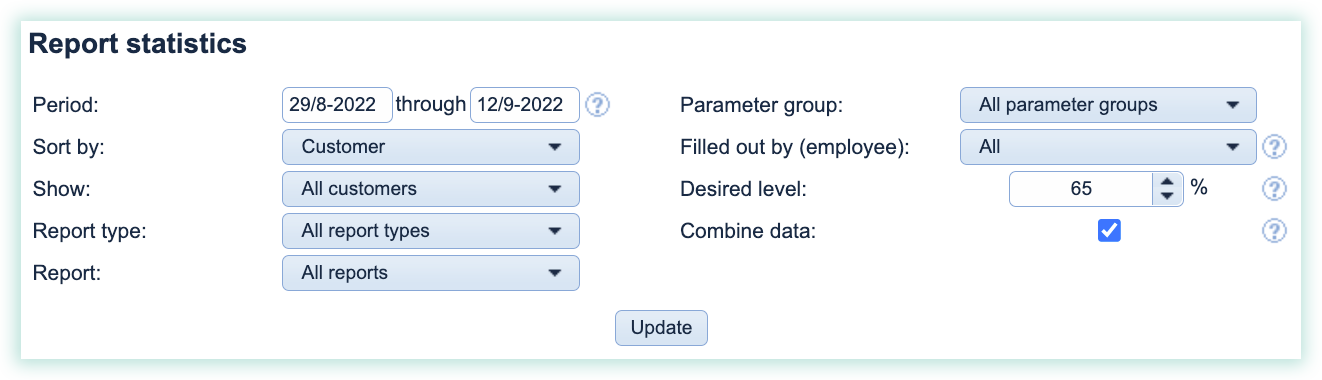
Under Statistics you are able to see a graphical overview of the completed reports.
You have different options to choose which reports are being shown in the statistic by choosing or sorting the reports based on e.g. time periods, customers, report types, and more.
This is how you set up report templates so that employees are able to see the statistics
When you set up a report template, which employees should be able to see in the report statistics, it is a requirement for the report to be set to: Can view or Can fill in.
In the following, you can read how to do it:
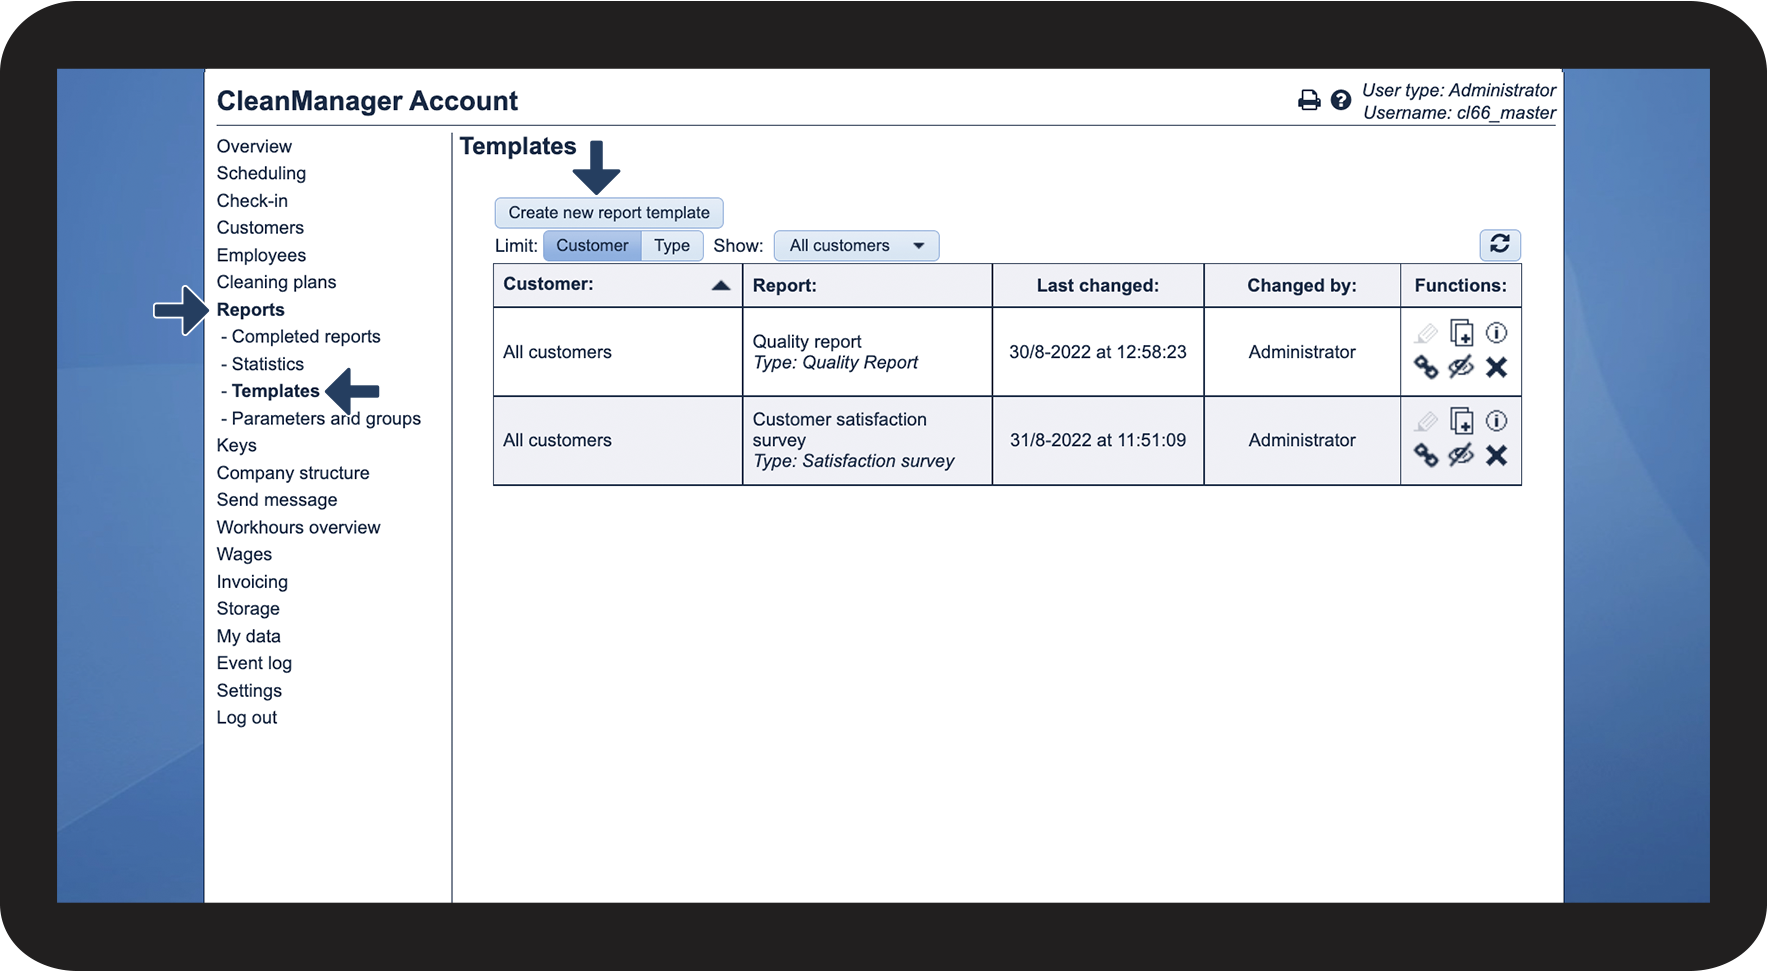
To set up this setting, go to: