What determines the score of a report?
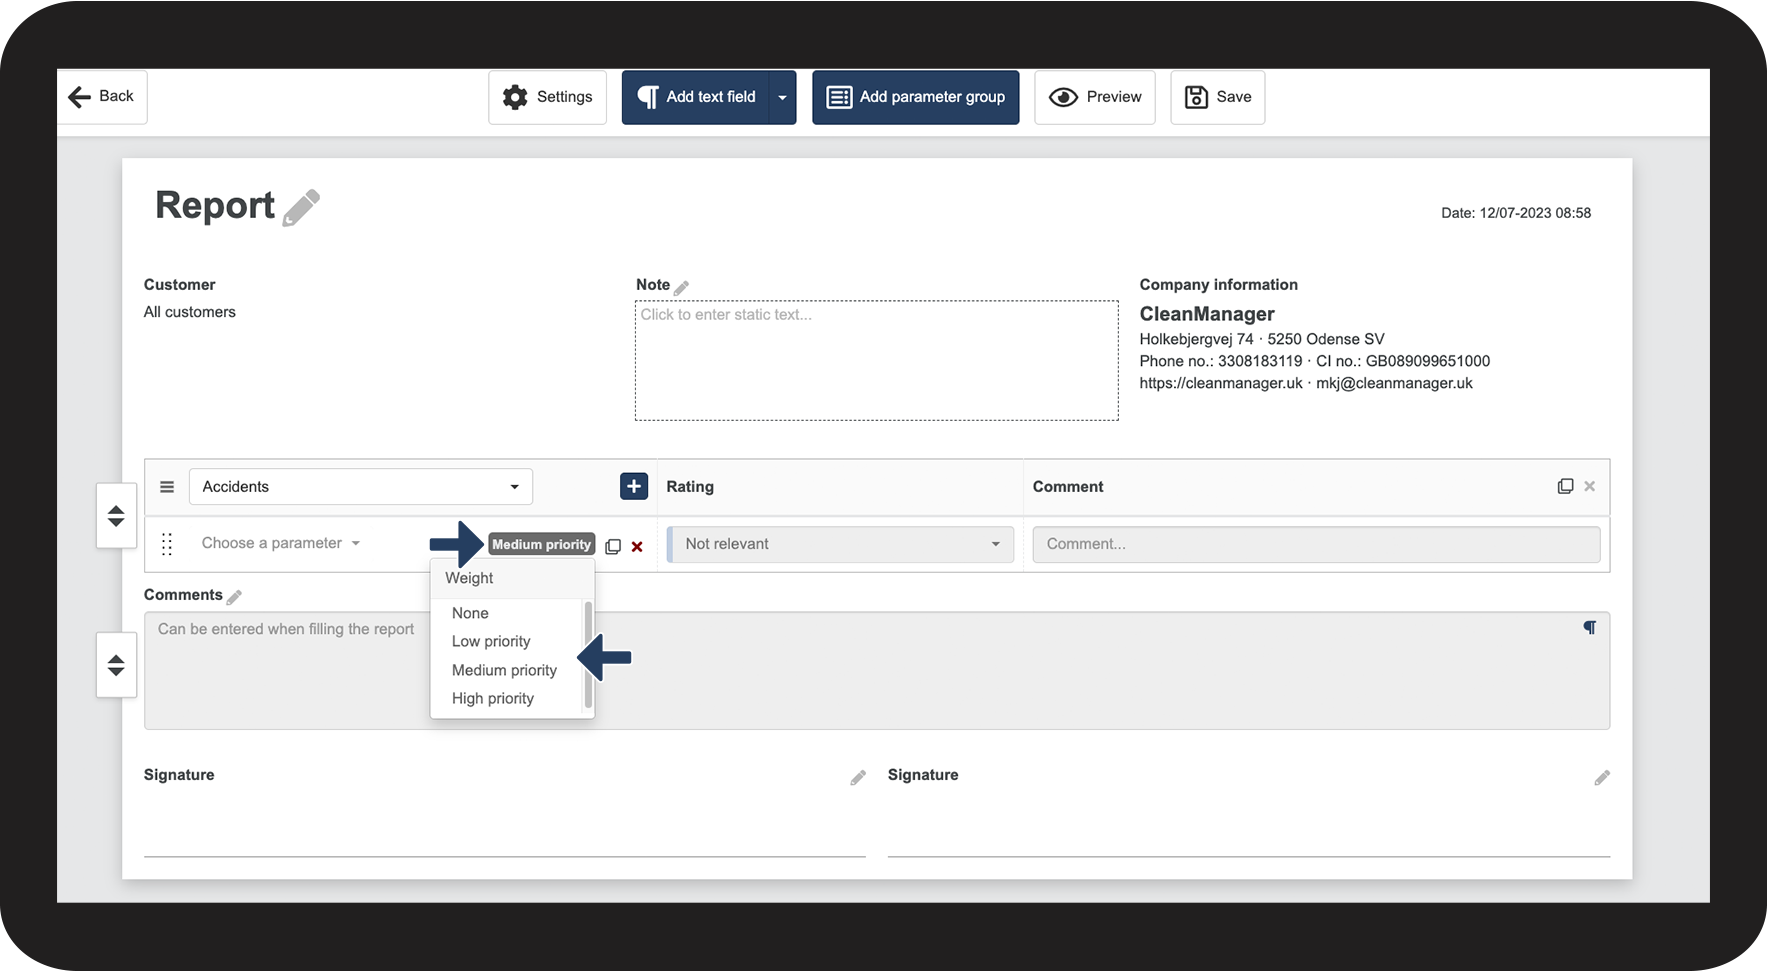
In a report template, each parameter can be set to a priority, which decides how much it will weigh in the calculation of the score.
The weight is divided into 4 priorities: None, low, medium, or high priority.
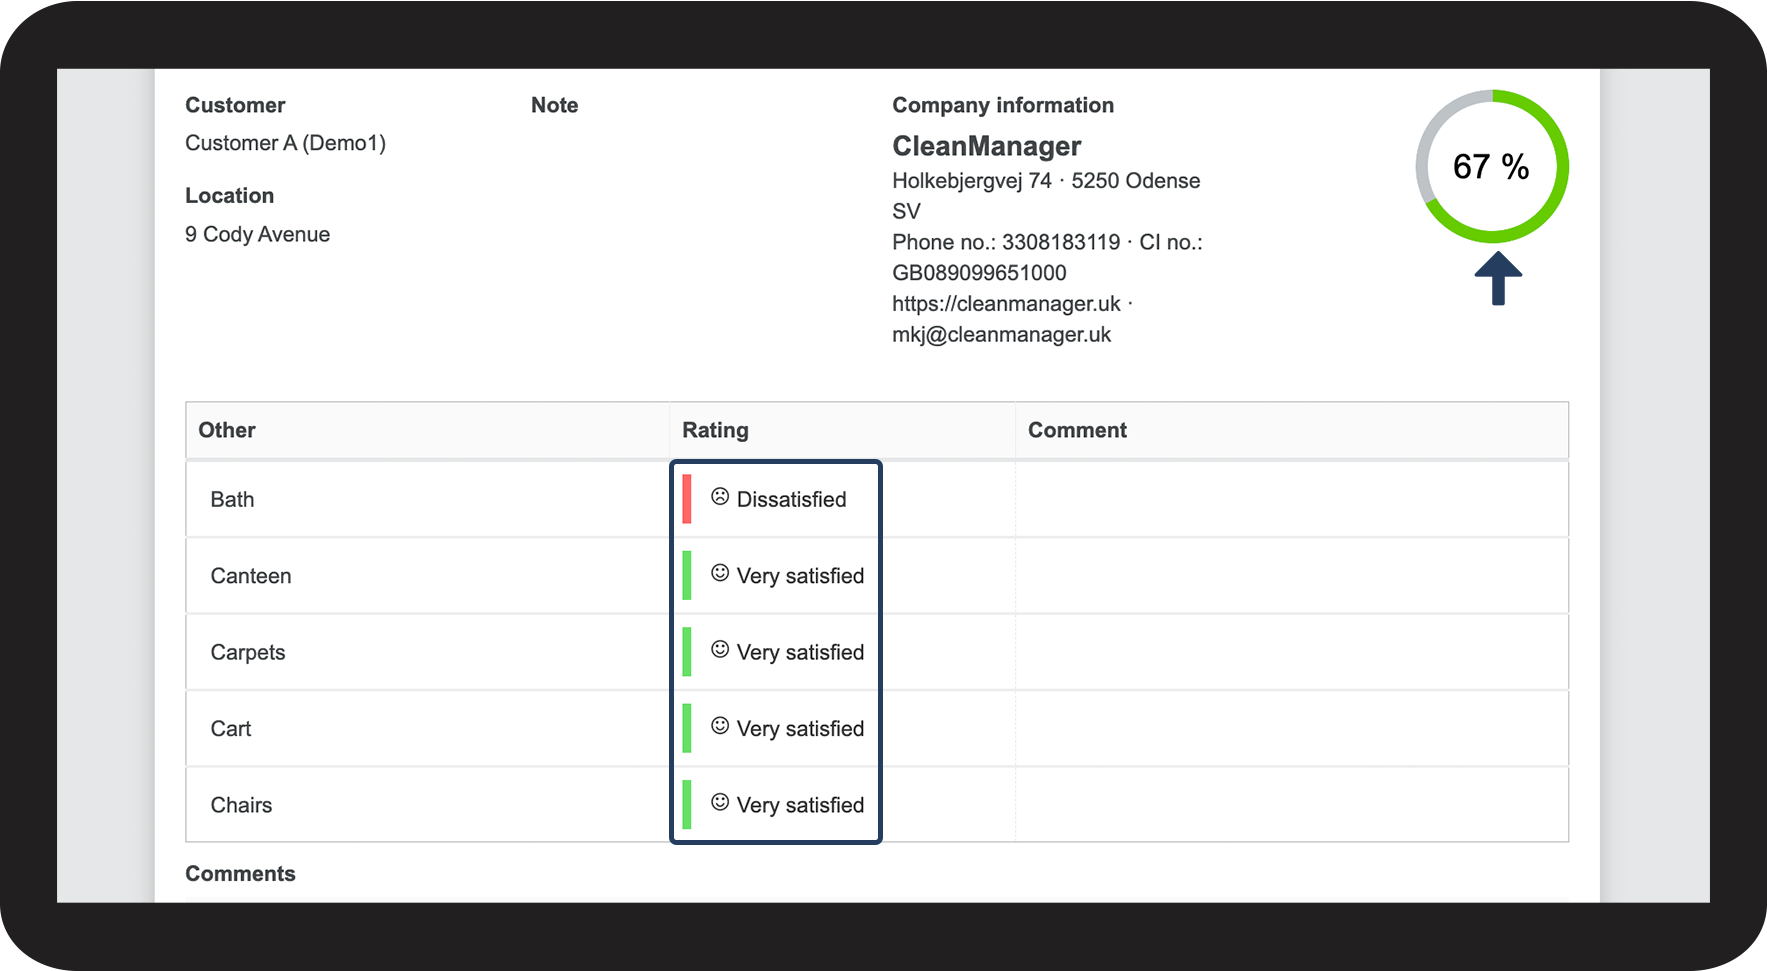
When you fill out a report, you can use values to rate each parameter. The priorities combined with the values for the parameters determine the final score of a report.
This article will provide some examples to illustrate what happens if you change the weight of a parameter.
In this article, you will learn how changing the priority can affect the final score of the report:
- How does each priority get weighted?
- Use of medium priority
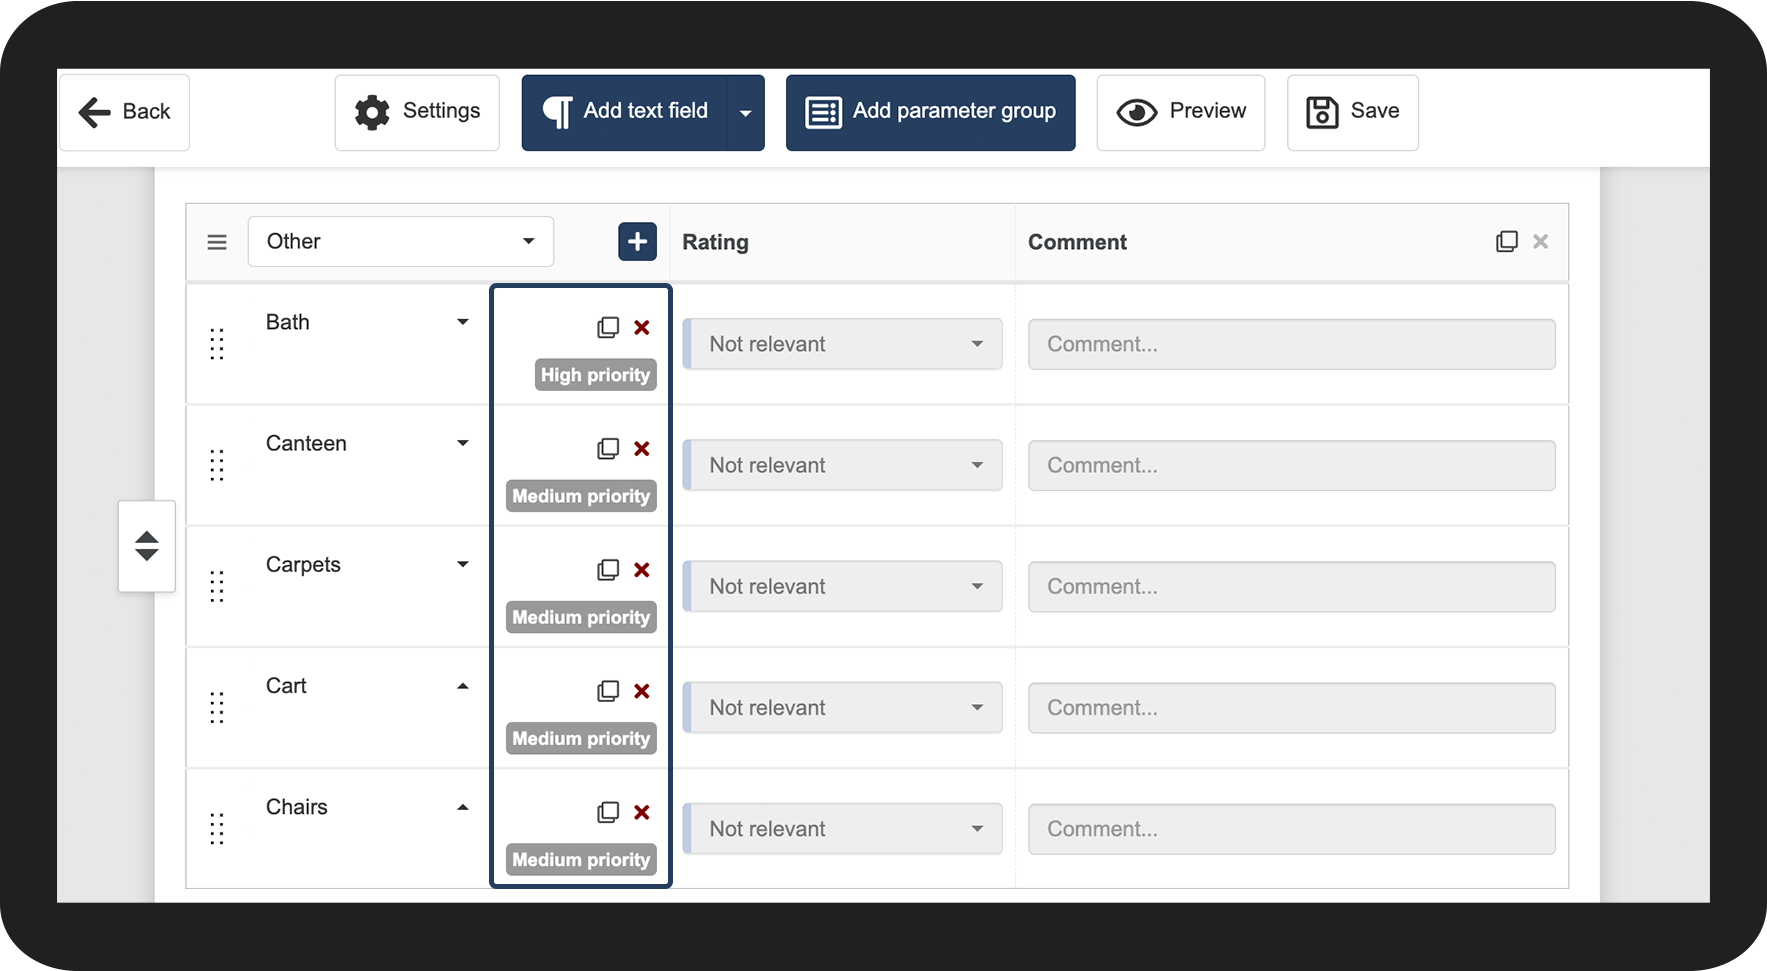
- Use of high priority
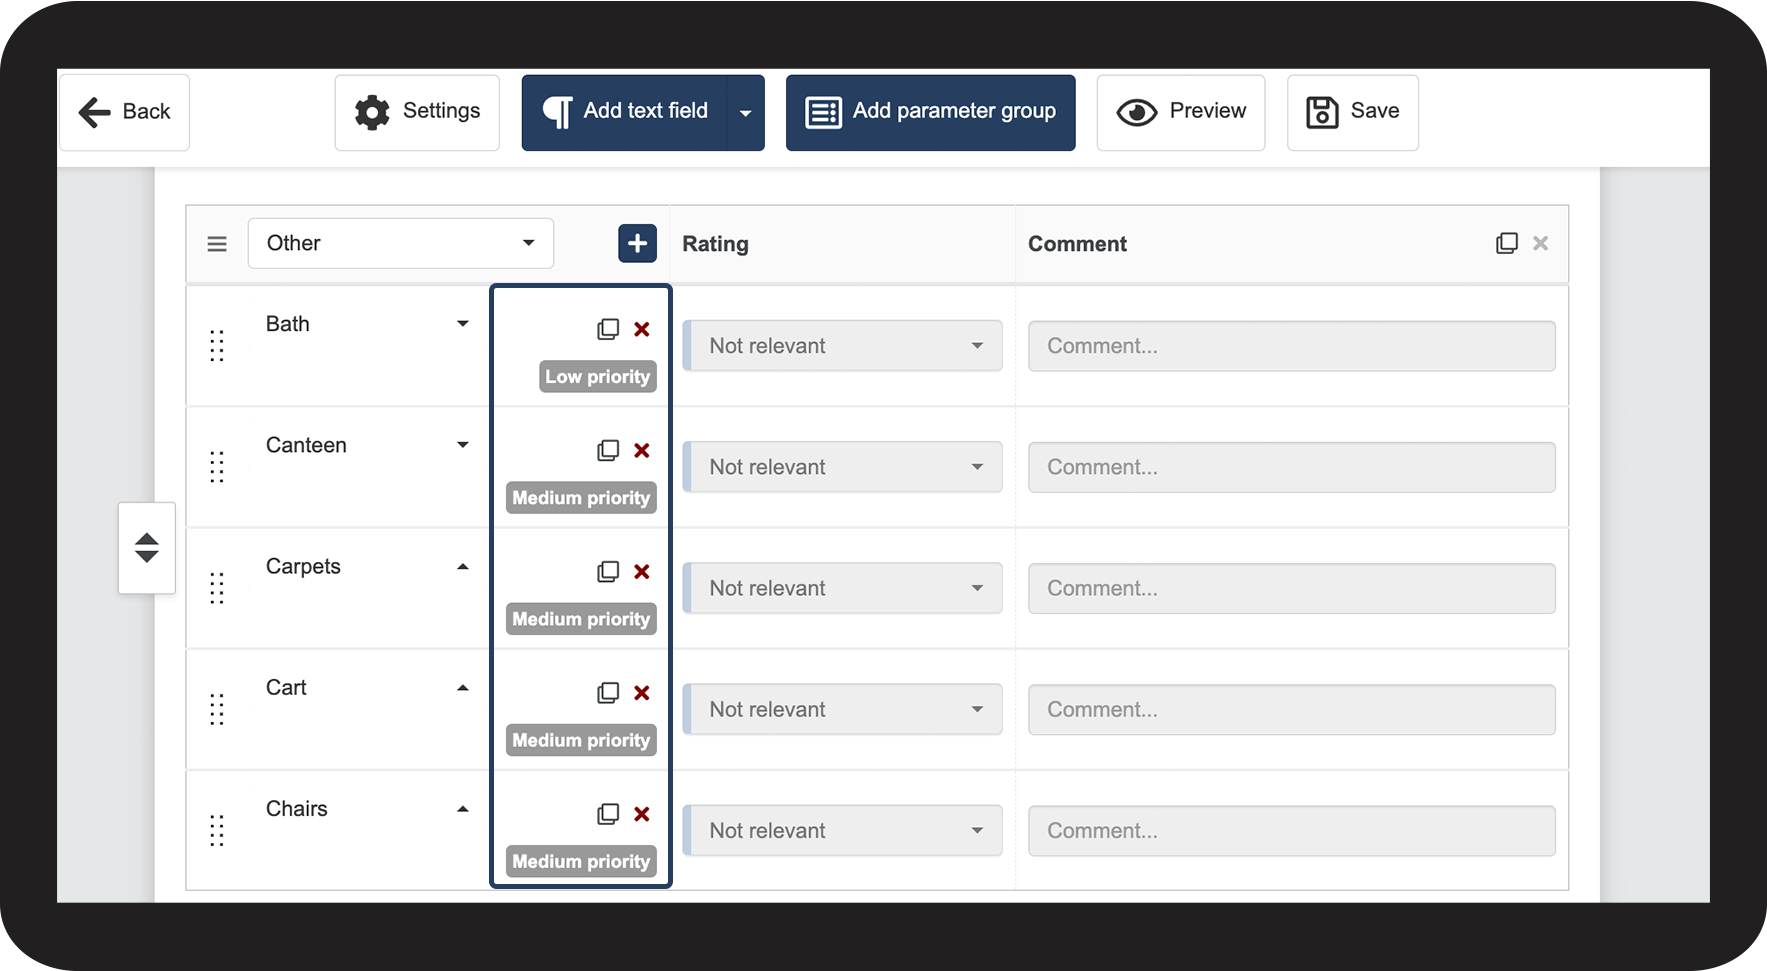
- Use of low priority
- Use of no priority
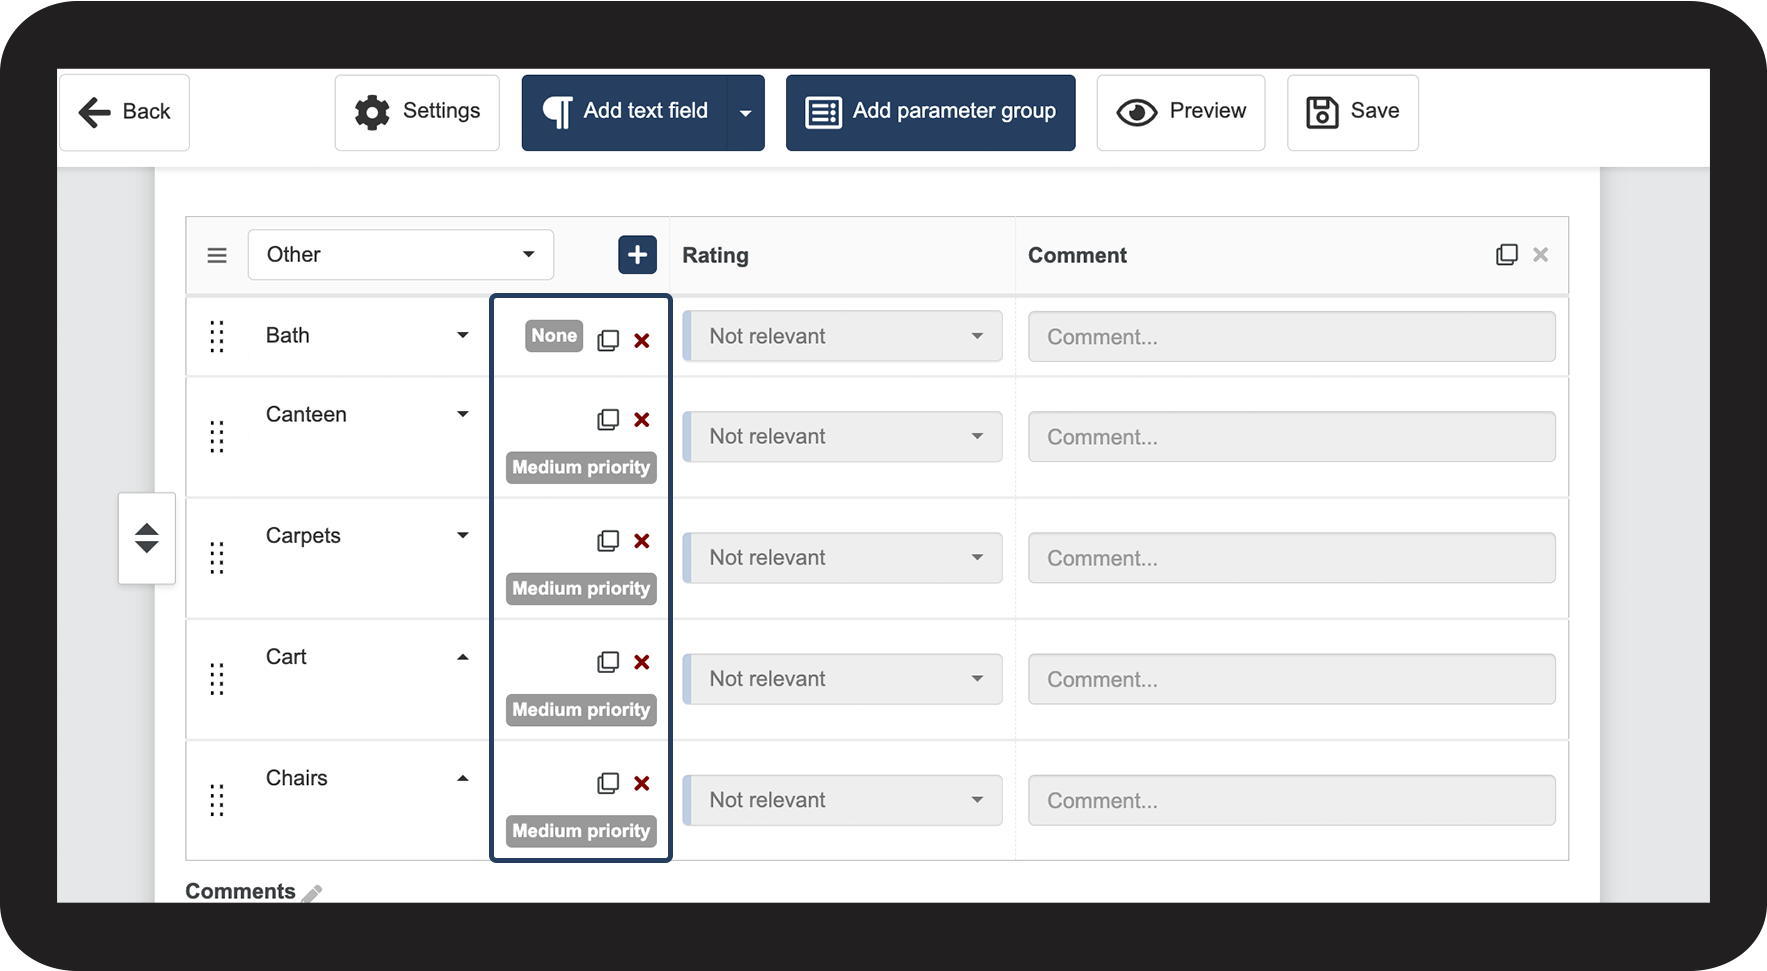
Weight for each priority
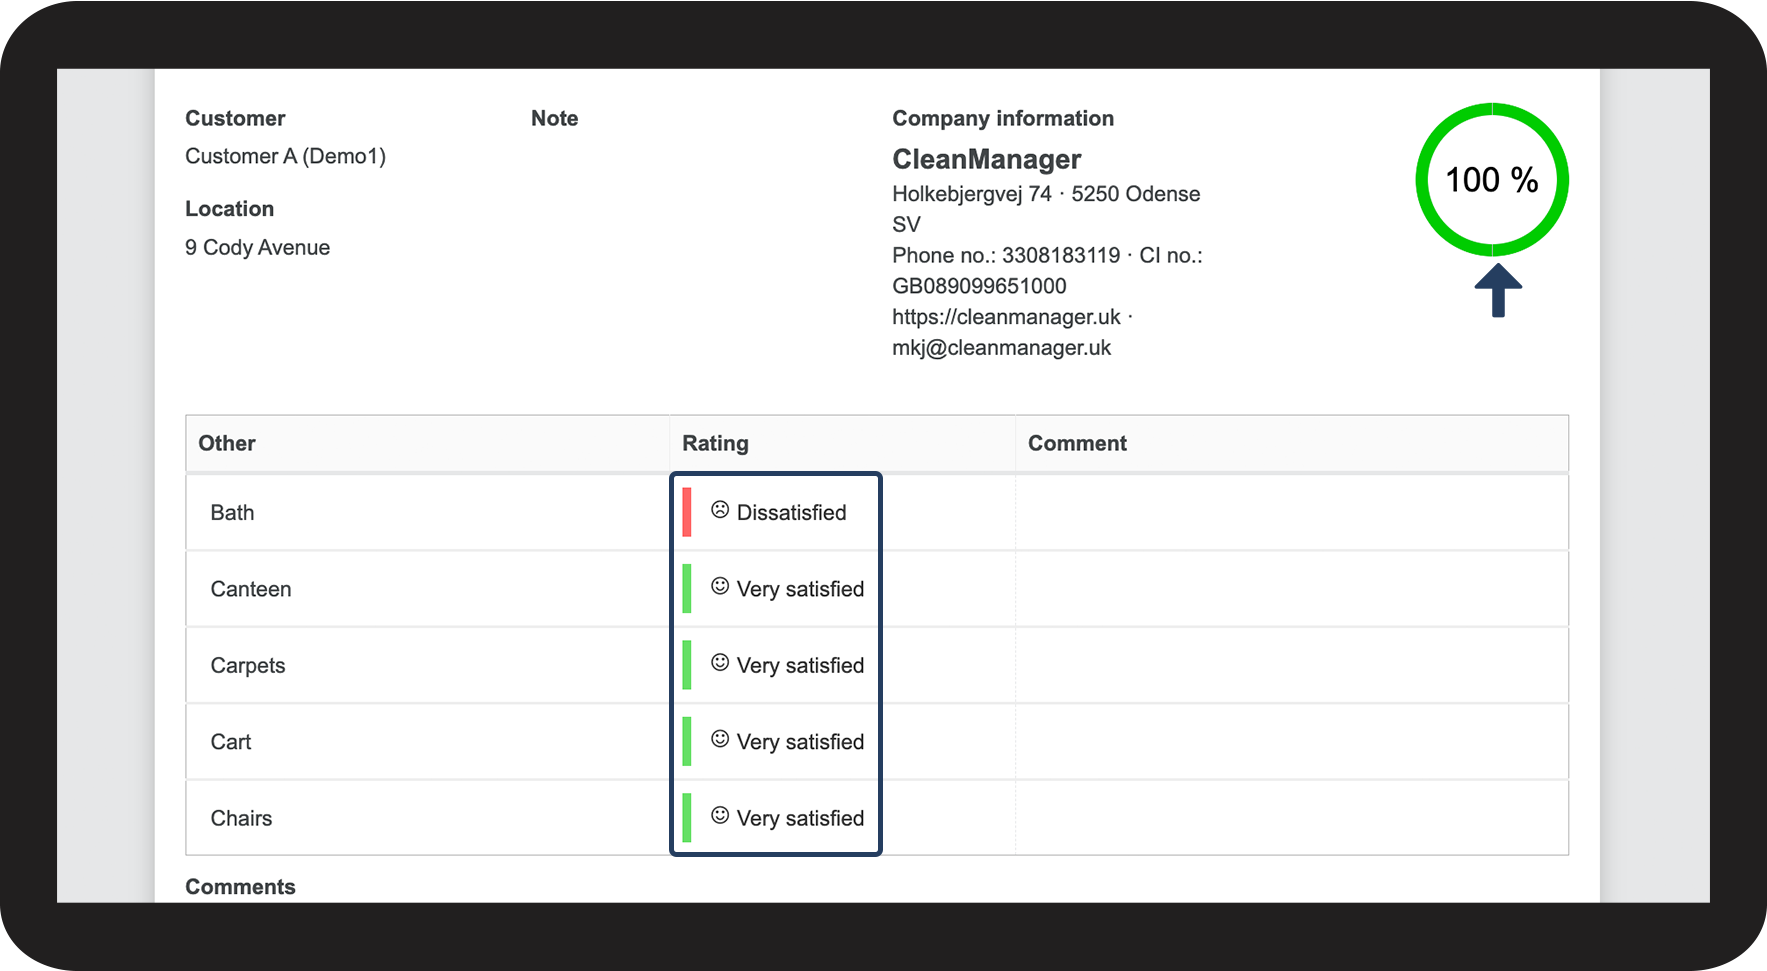
Use of medium priority

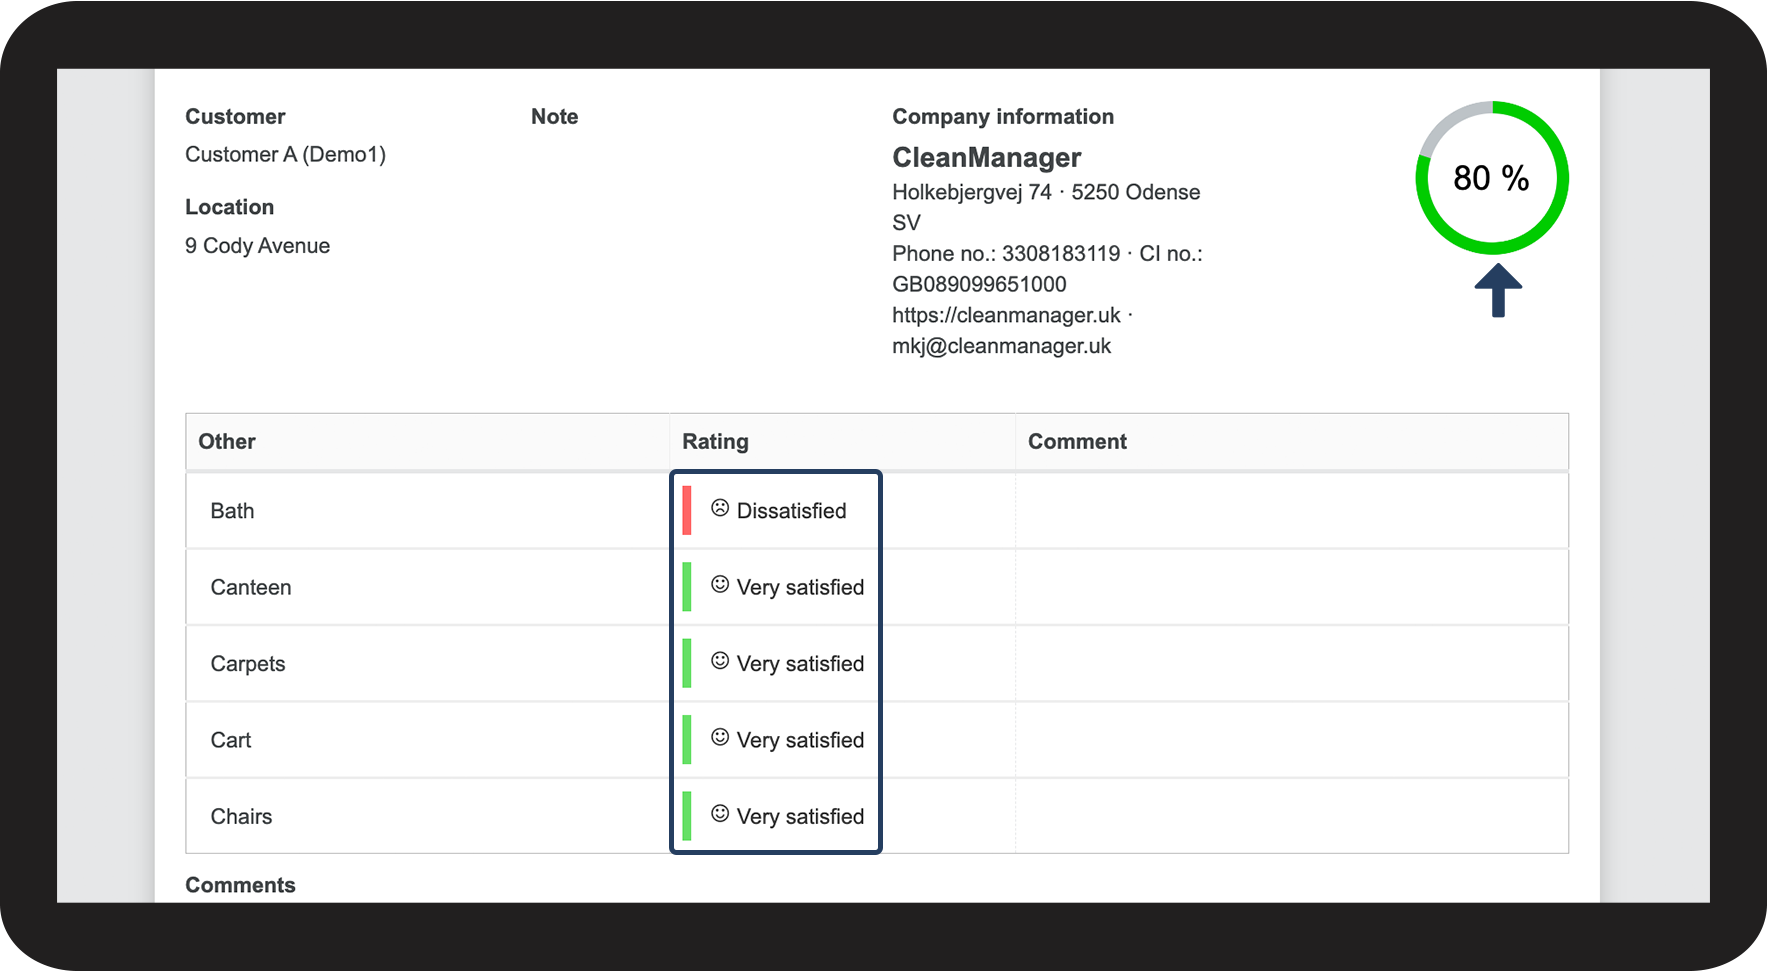
Use of high priority
Use of low priority

Use of no priority