What features do I have access to in the submenu Statistics?
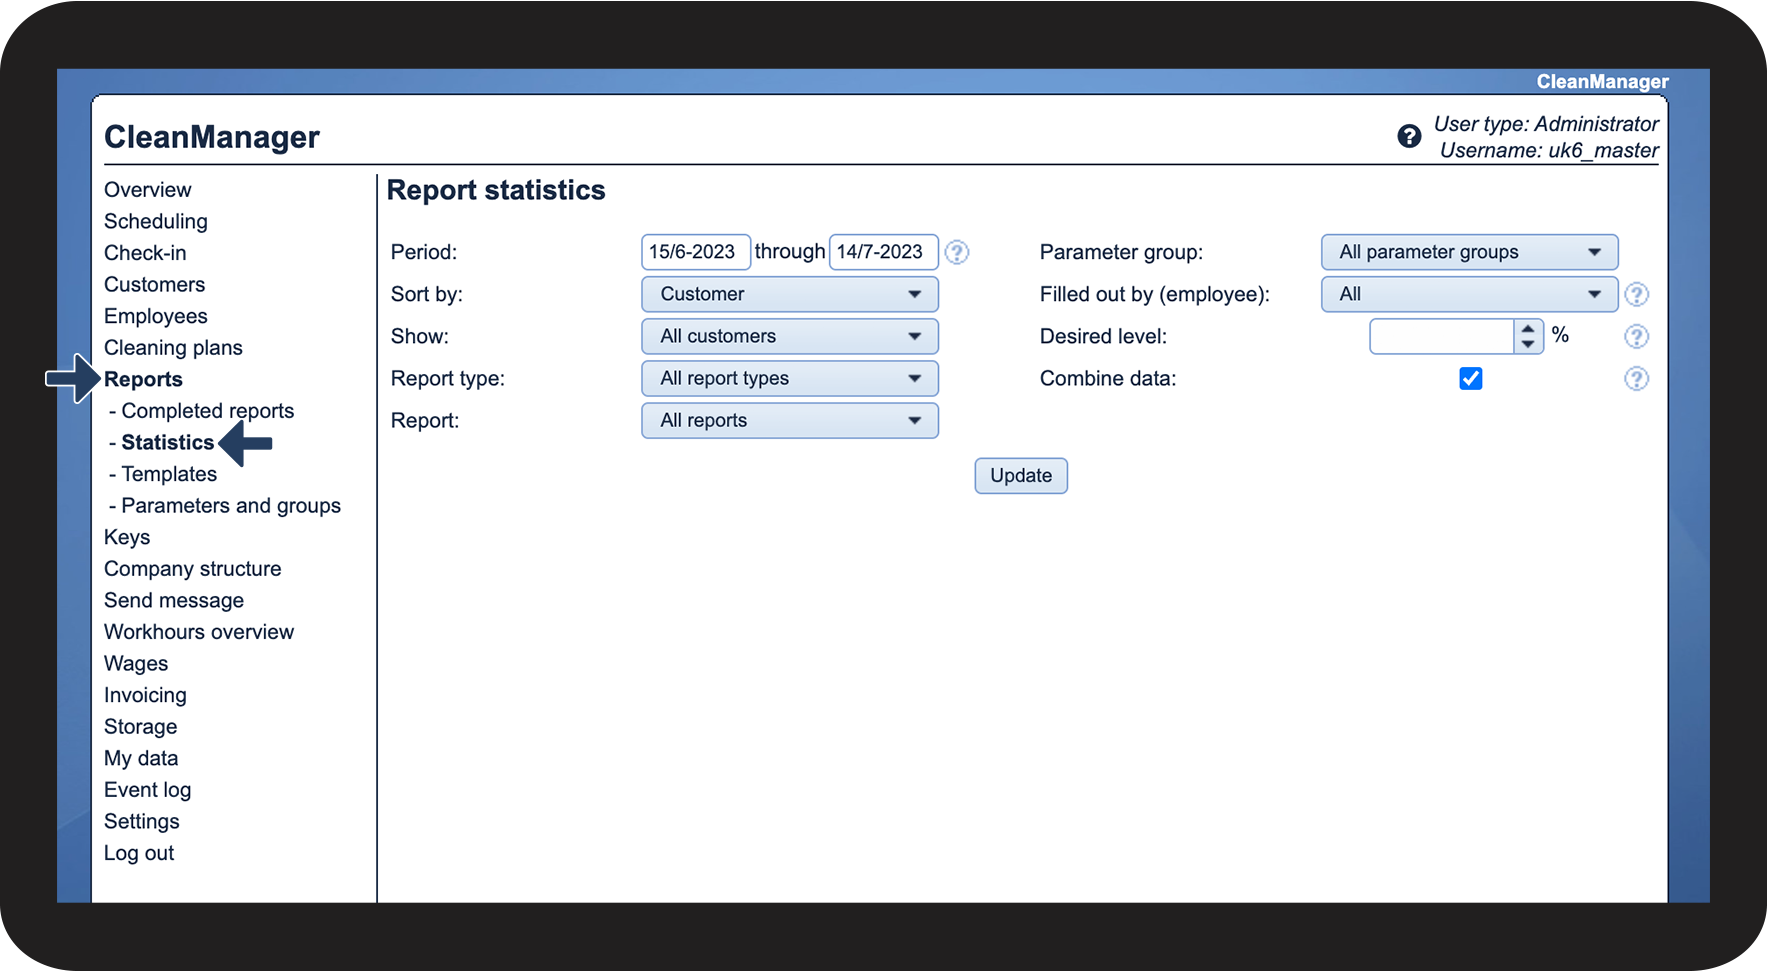
You can see statistics for your completed reports in the submenu Statistics.
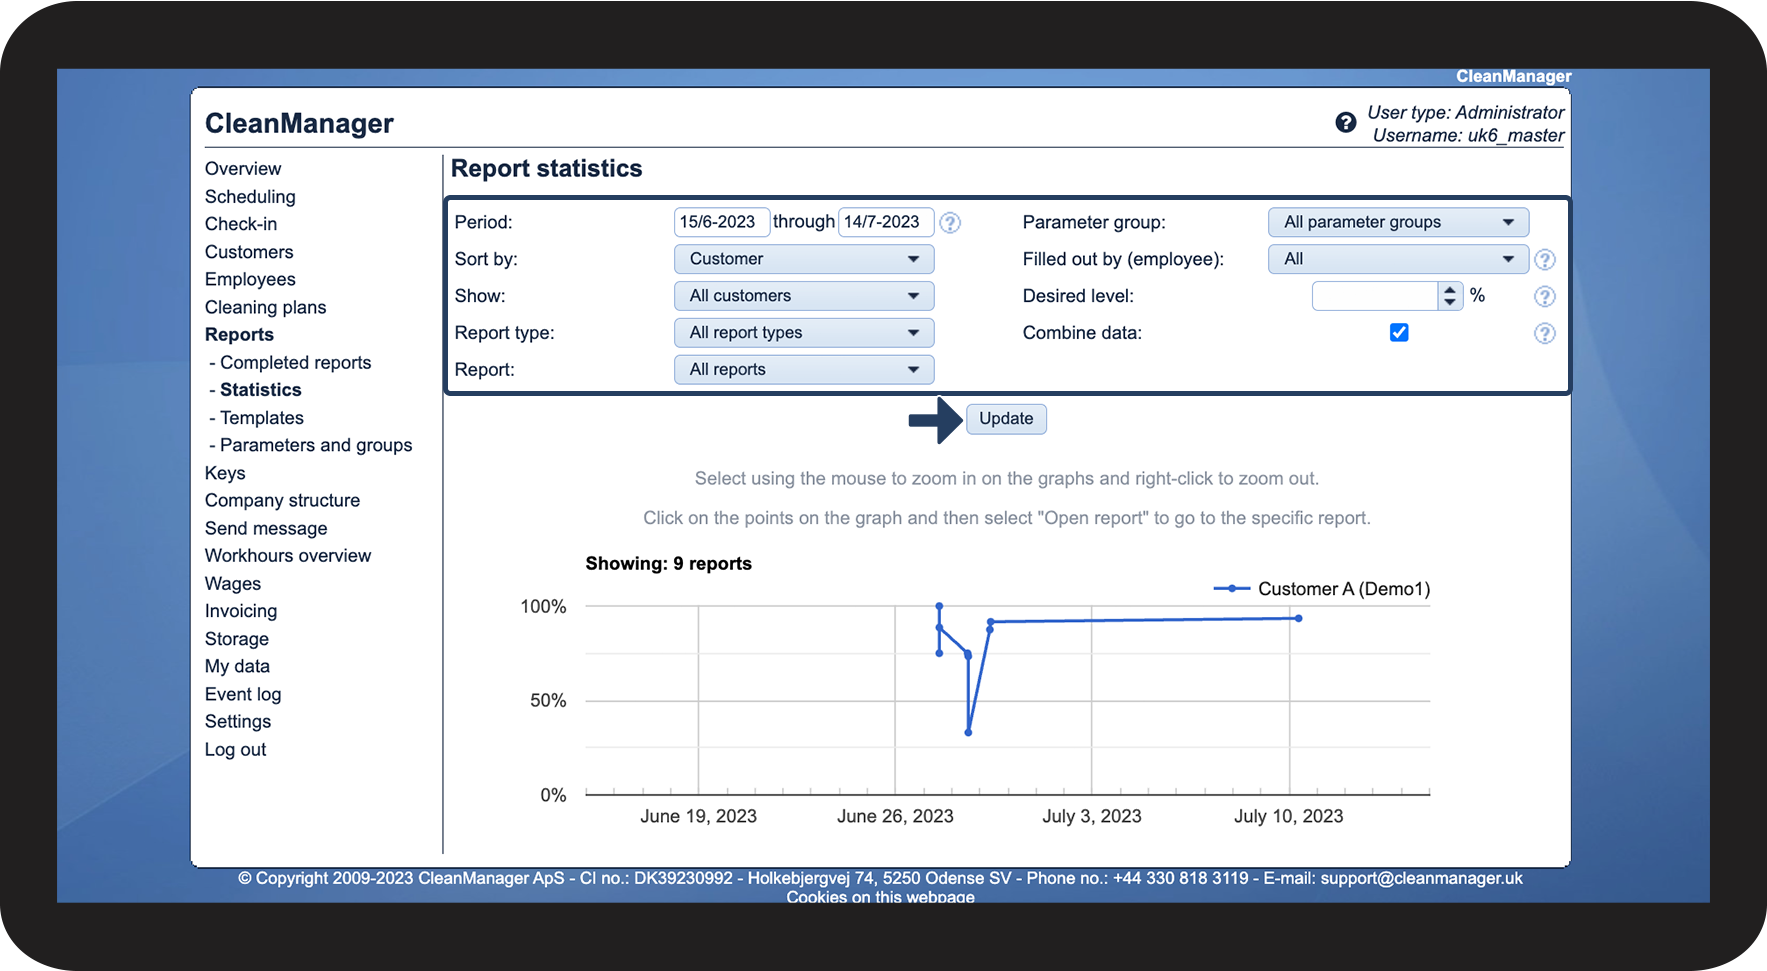
To narrow down your search result, you can set a specific time period and adjust the filters.
The graph comes with two different display functions:
You can zoom in/out on the time period, and you can click on a dot to open a report that is featured.
In this article, you will learn:
- How to see your statistics
- How to zoom in and out on the graph
- How to open a report through the graph
How to find your statistics
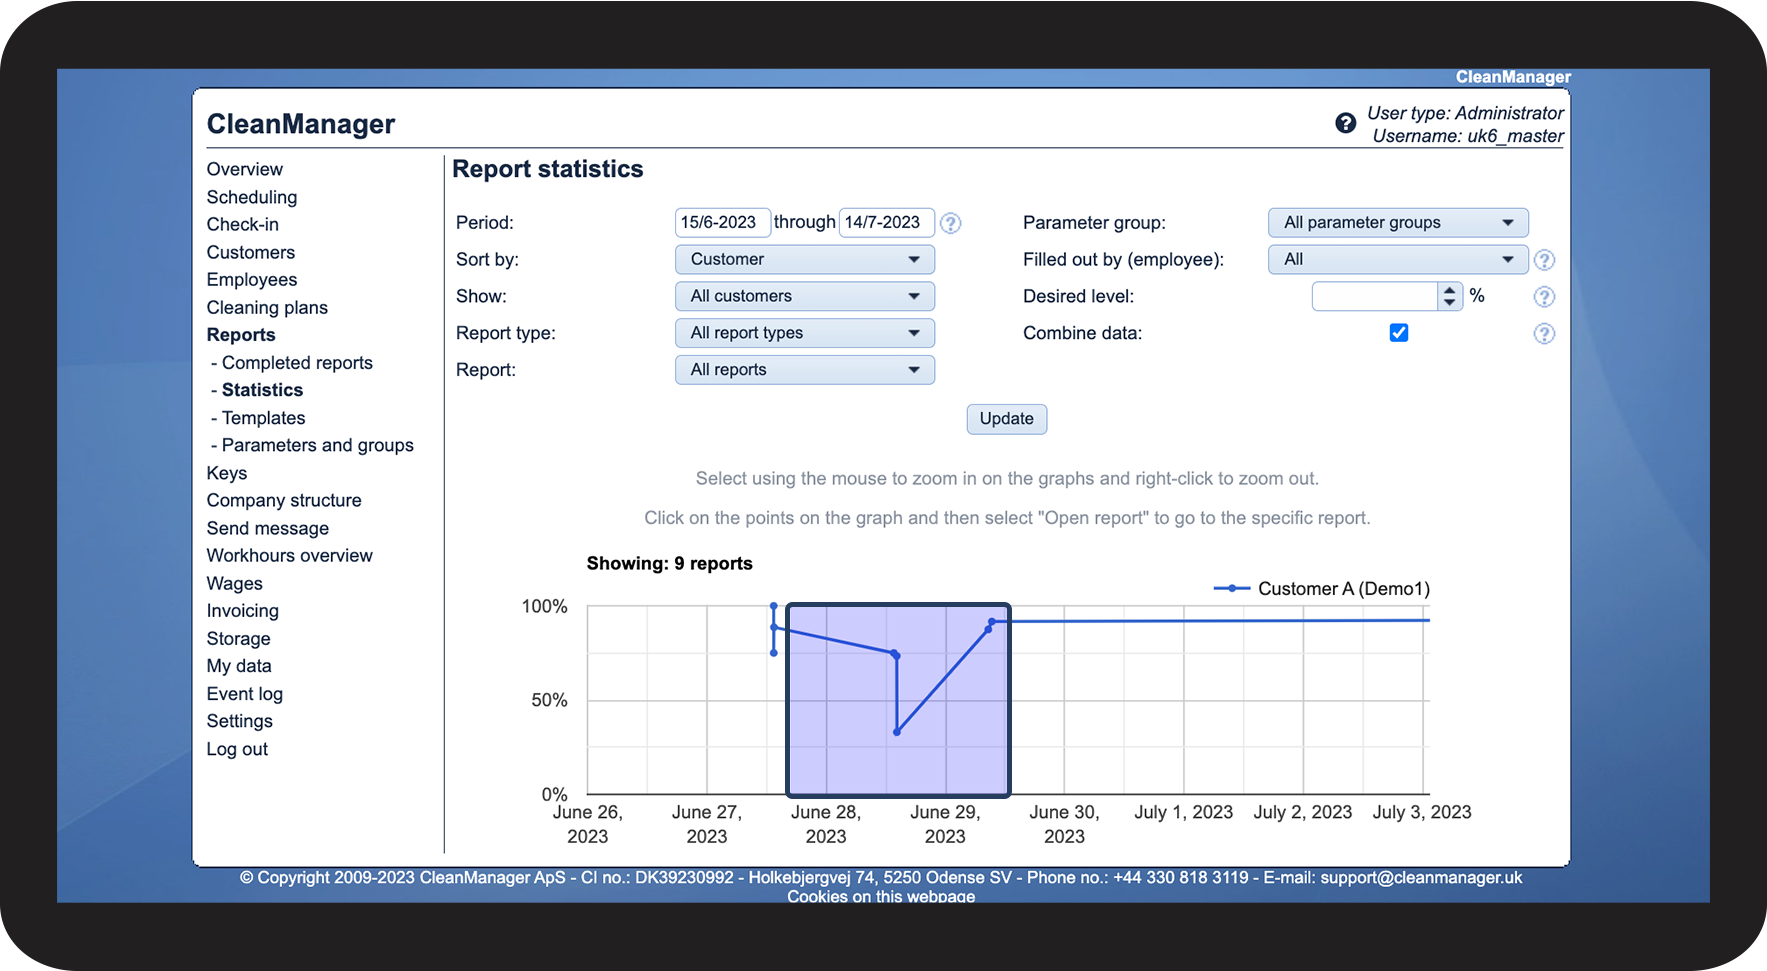
How to zoom in and out on the graph
The graph will display all reports in the selected time period that match the filters.
You can narrow it down further by zooming in on the graph.
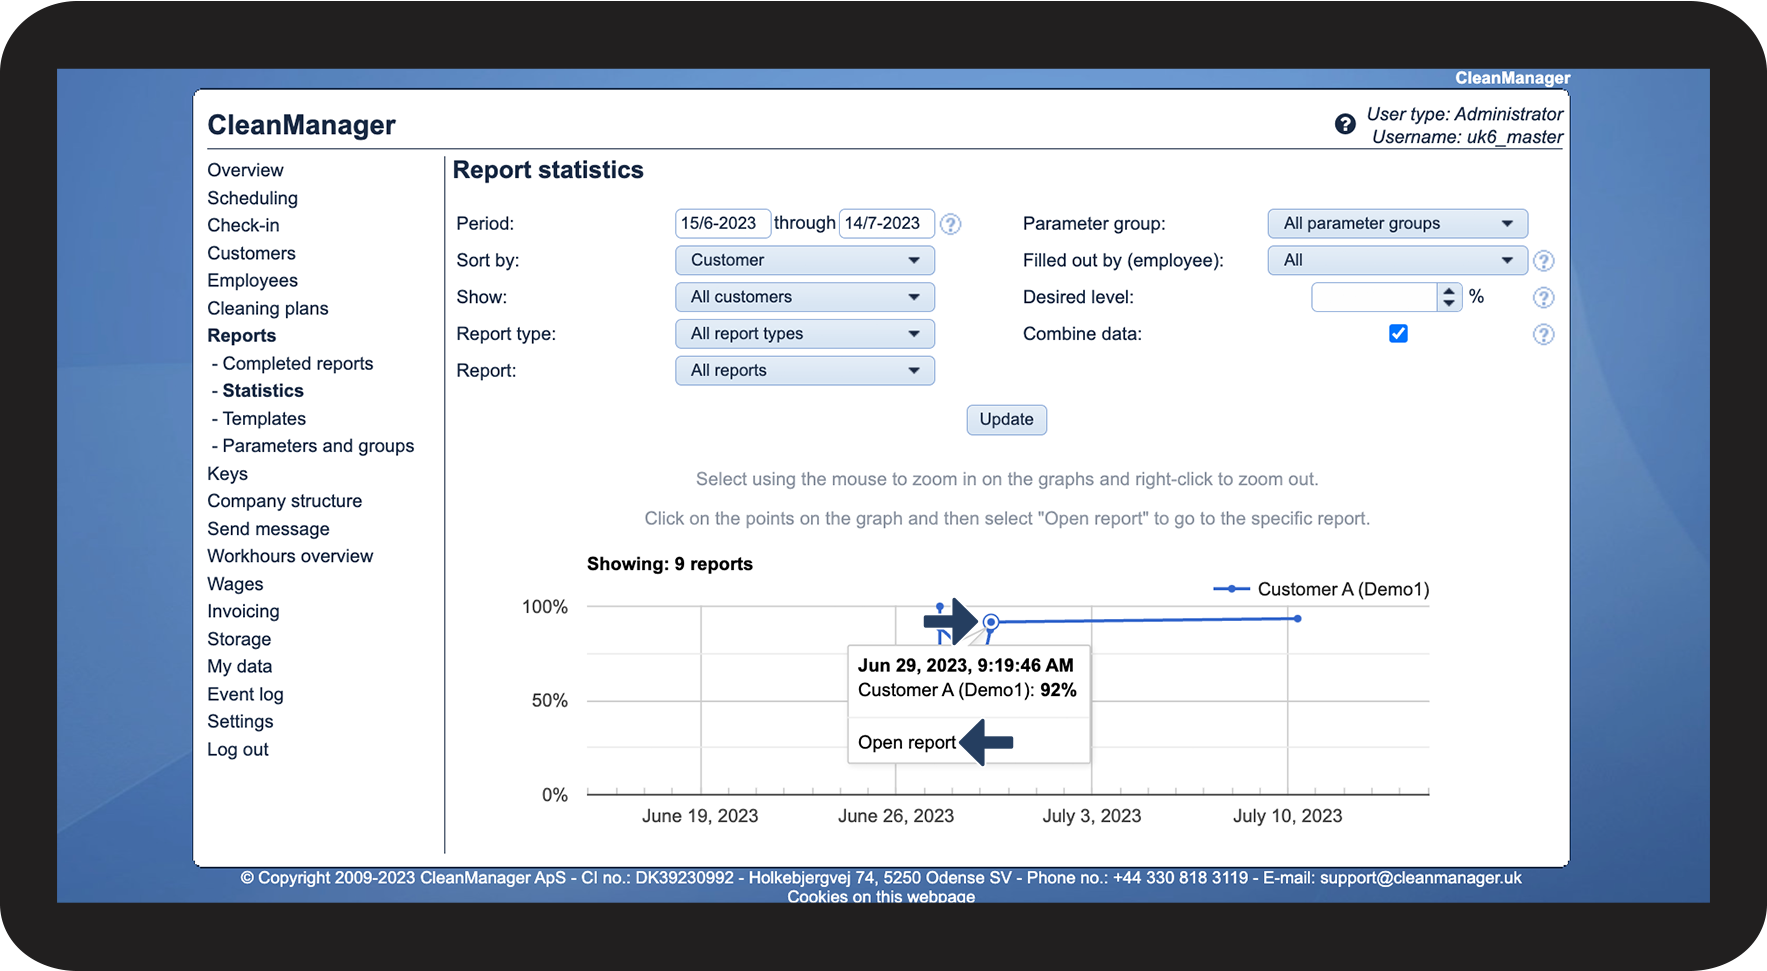
How to open a report through the graph
The dots in the graph mark a completed report based on the date of completion and its final score in percentage.