Skip to content
English
  • There are no suggestions because the search field is empty.

Extracting data as an Employee (Statistics)

How do I extract data from the reports as an Employee?

As an employee, you have access to the completed reports that you have been associated with.

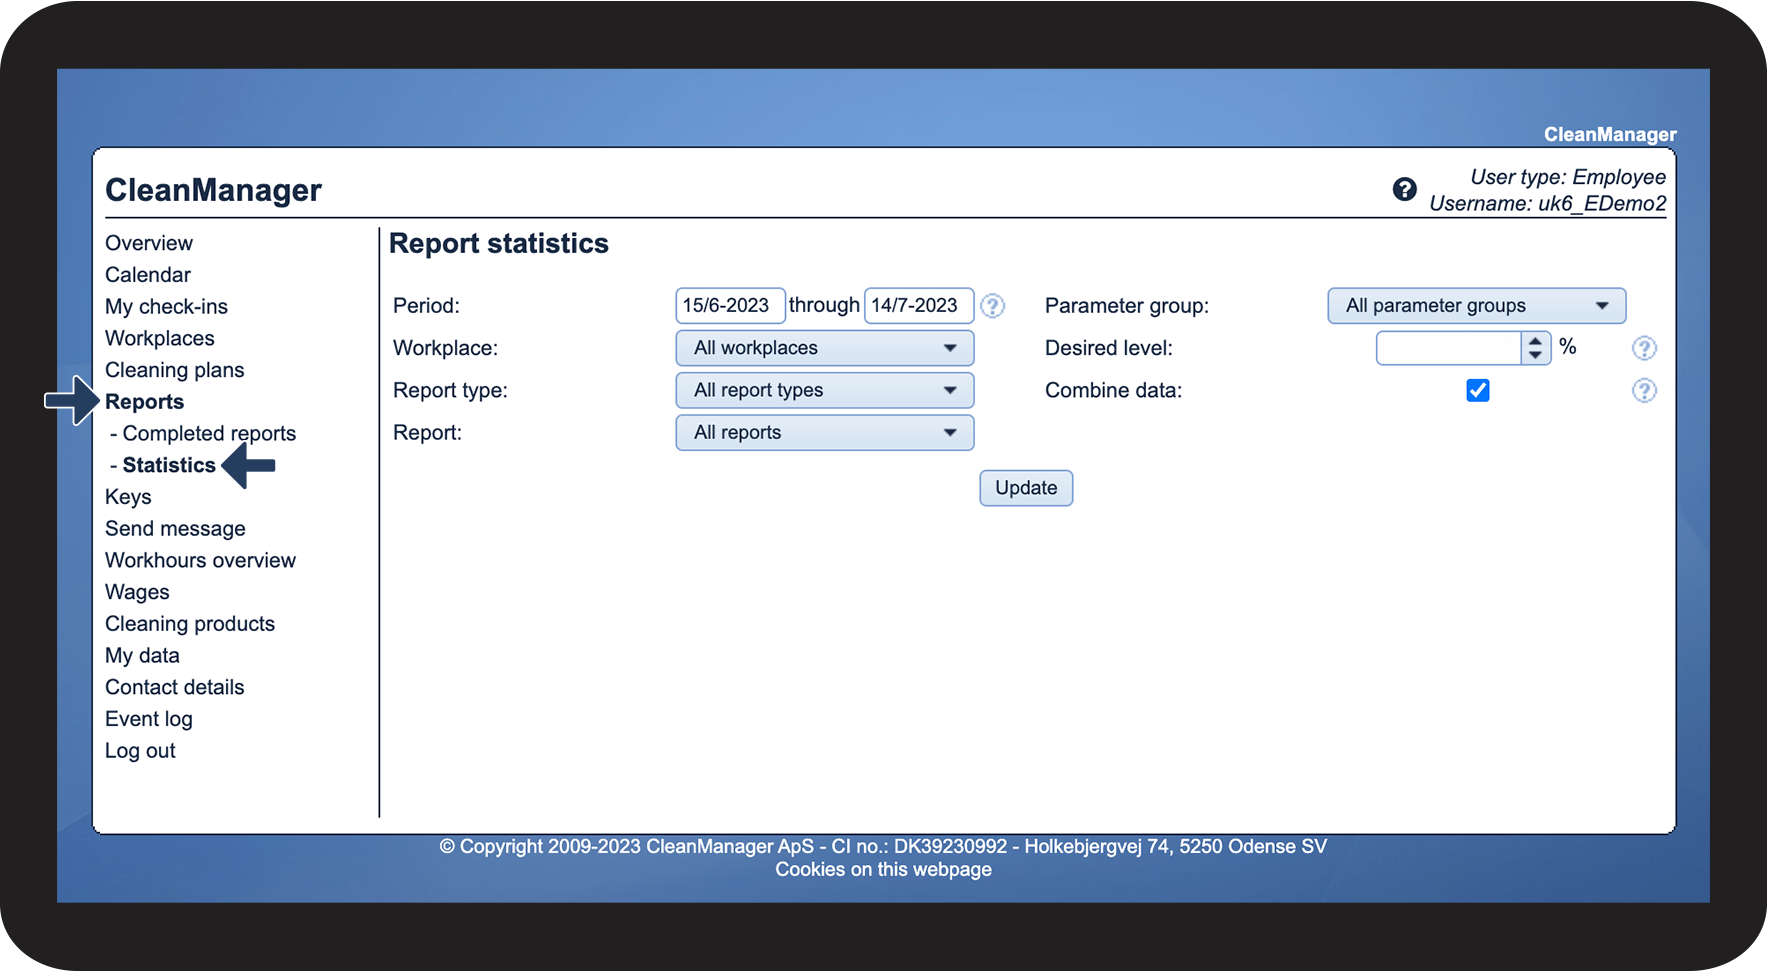
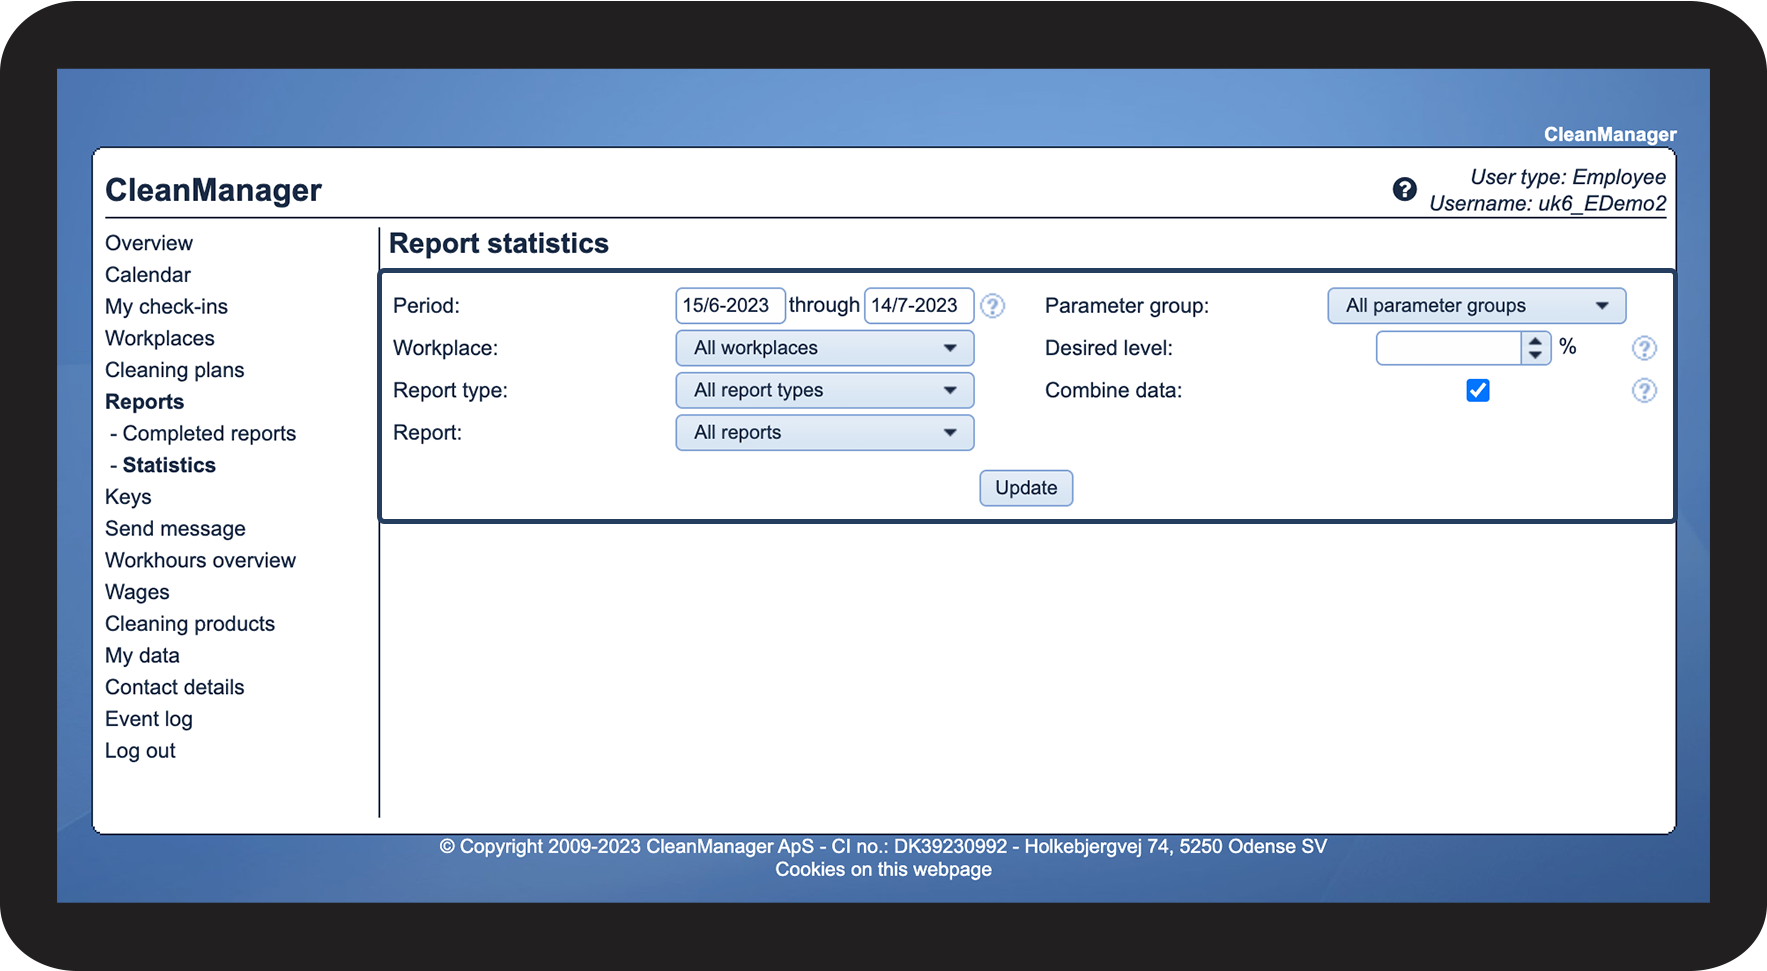
When you go to Statistics, you have the option to specify what data you want to be extracted.

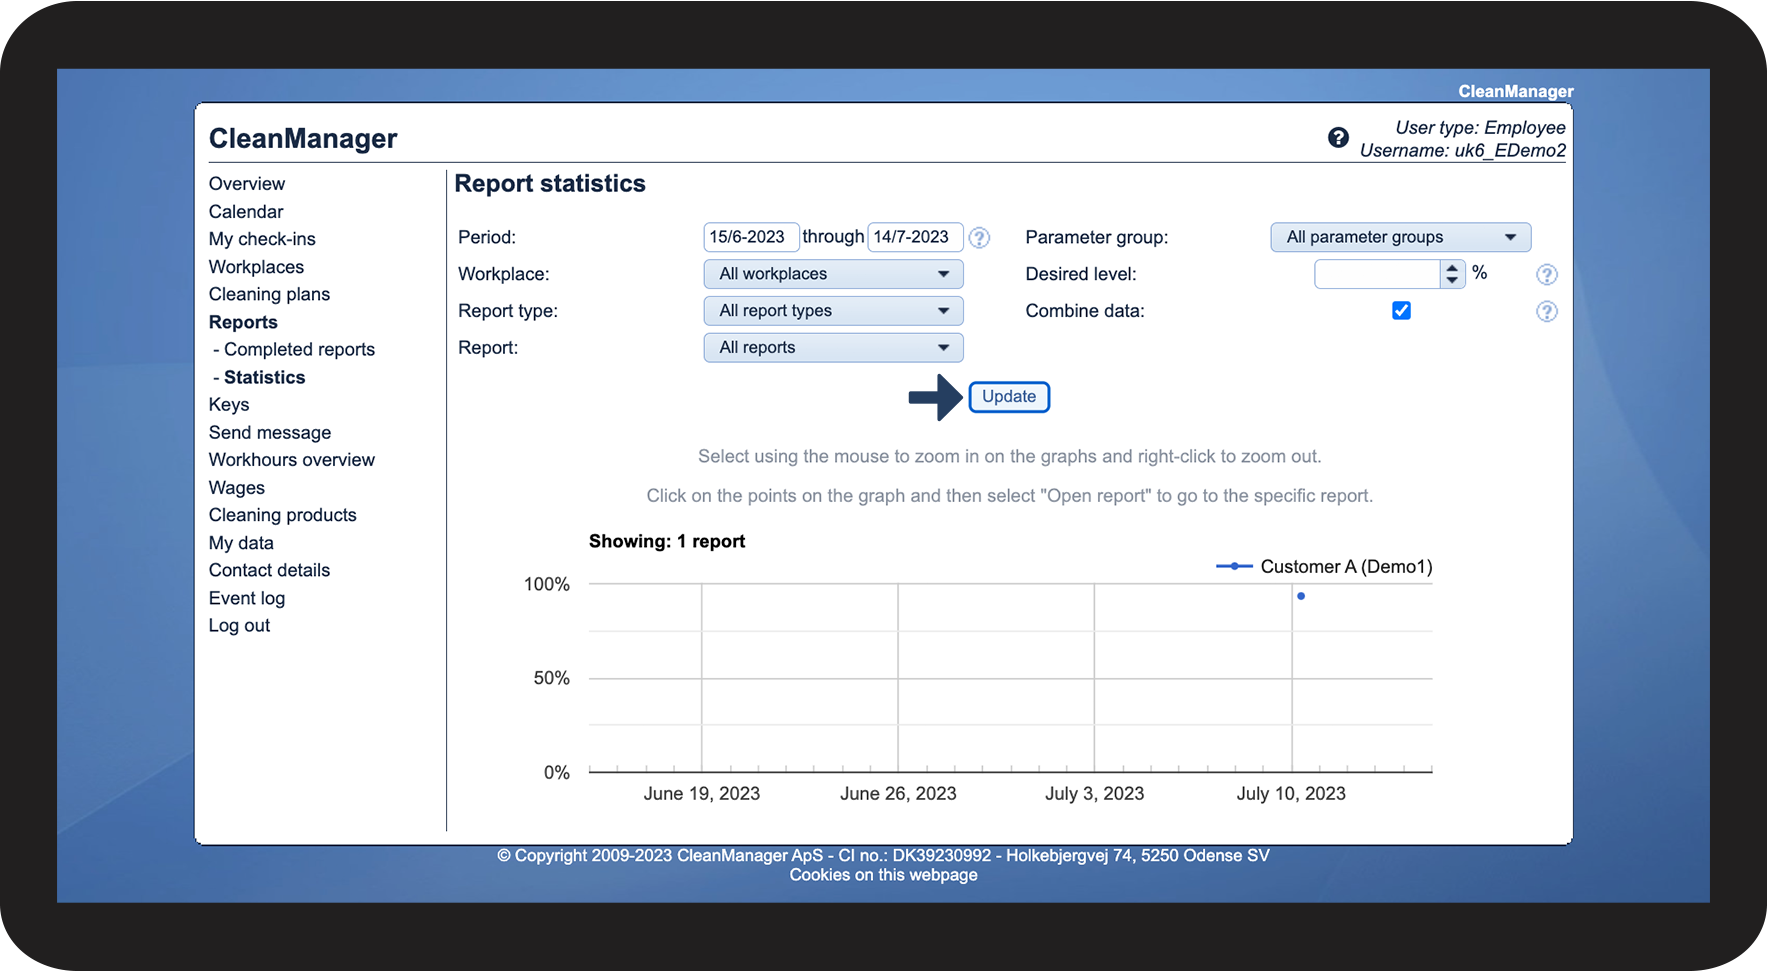
Example: This is useful if you want a quick overview of the scores on a specific report type for a customer.


In this article, you will learn about your options for extracting data:


How to sort your data extraction

number_1.png
In the menu, go to Reports > Statistics

1.png

number_2.png
Adjust the filters
 
See a description of the different options in section 2: Description of your options

2.png

number_3.png
Click on Update to see the result
 
You will be shown a graph based on the score of the reports that match your filters

3.png


Description of your options

Period

You can narrow or broaden your search by entering a start and end date.

The graph will only focus on this time period.

Workplace
Report type

You can decide whether you want to look at all report types or a specific type. Depending on your choices, it may impact your options in Report.

Report

This function lets you pick a specific report template based on your input in Report type.

Parameter group

You can use this if you wish to extract data on a specific parameter group.

Desired level

Mark your desired level for the report score. You can enter a percentage value from 0 to 100. If you enter a number, your graph will display a red dotted line to mark your bottom line. You can also leave the function blank.

Combine data
This gives you the option to combine your datasets into one graph. Your data will be inserted into one graph, with each dataset in its own color. Alternatively, each dataset will be drawn in separate graphs.